logo name only equal

The Golden Grain Cycle

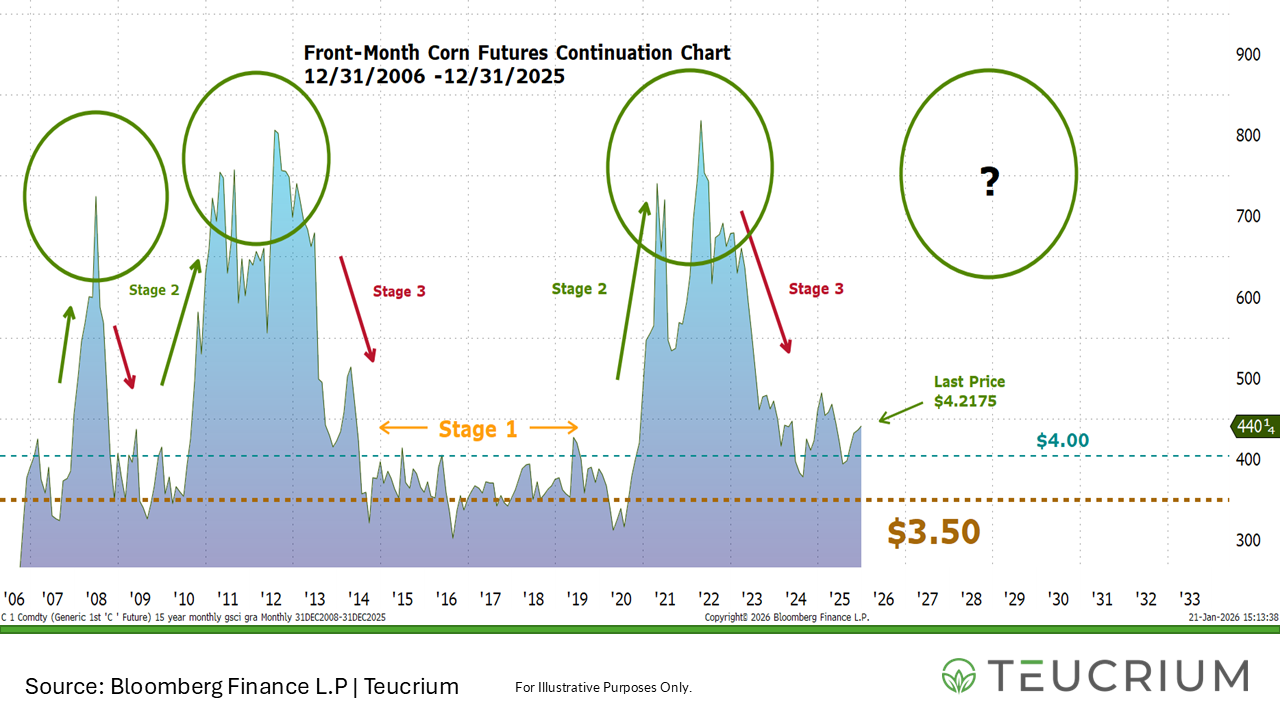
Front-Month Corn Futures Weekly - Last Price as of 09/13/2024: $3.9075
Golden Grain Cycle 20240913

The Cycle

"Grains tend to trade at or near their cost of production until there is a supply disruption at which point prices historically have moved dramatically higher. 

Over time as production increases and/or demand decreases, inventories are rebuilt and prices trend back toward the cost of production once again.”

– Sal Gilbertie 

Stage 1

Prices trade at or near the cost of production

Stage 2

Prices Advance Amid supply/demand imbalance

Stage 3

Supplies build due to increased output and prices head back toward the cost of production


3

Current Stage (entering 1)

$3.50

Historical approximate futures price equivalent to the national average cost of production

3x

The Number of times front-month corn futures have doubled from Stage 1 levels.

Understanding the Golden Grain Cycle

The Golden Grain Cycle in grain markets is, at its core, cosmic. Consider that growing seasons are dictated by the tilting of the Earth’s axis in proximity to the sun. As such, in North America, there is only one harvest per year.
 
There are years when production exceeds demand, and prices are low. Alternatively, there are years when production lags demand, and prices are elevated. The variability of production in the face of steady, and often growing demand, sets the stage for the grain market cycle. This cycle has repeated throughout history, offering those who recognize the cycle an opportunity for potential profit. Hence, we refer to the cycle as the Golden Grain Cycle.  
 
Typically, grain production exceeds demand. The excess is held in storage as inventory to be drawn down in years when demand exceeds production. When production exceeds demand, market prices will gravitate toward the cost of production effectively squeezing a farmer’s profit margins (Stage 1).
 
Lower profit margins can (and often do) result in fewer acres planted. Reduced plantings and/or adverse weather have historically led to supply/demand imbalances and demand exceed production. Inventories are dawn down and prices advance (Stage 2).
 
Historically, we have seen that as market conditions change and prices rise, farmers reverse course and plant more acres. As production catches back up with demand prices trend lower, heading back toward the cost of production (Stage 3). 


Subscribe & Keep up with the Golden Grain Cycle

For additional market commentary please follow us on X @TeucriumETFs, and LinkedIn, and subscribe to our market commentary


The information provided along with associated documents is intended to provide a broad overview for discussion purposes. It is subject to change and should not be taken as financial or investment advice. Teucrium Trading LLC and Teucrium Investment Advisors, LLC make no offers to sell, solicitations to buy, or recommendations for any security, nor do they offer advisory services.

Past performance is not indicative of future results. Teucrium disclaims any liability for any actions taken based on the information provided in this document.